eBPF学习笔记2
上一篇笔记里说编写运行BPF程序推荐2种方法:bpftrace和BCC,按照惯例来个hello world。
之前说过很多功能都是新版内核才支持,想使用CO-RE内核需要开启CONFIG_DEBUG_INFO_BTF=y和CONFIG_DEBUG_INFO=y 这两个编译选项,所以建议使用最新的发行版,比如:
- Ubuntu 20.10+
- Fedora 31+
- RHEL 8.2+
- Debian 11+
bpftrace
安装
根据安装说明结合自己环境的实际情况安装即可,比如我这里用的ubuntu直接使用:sudo apt-get install -y bpftrace安装,然后可以查看安装的版本:
root@iZj6c18dsejt417tcv4rv2Z:~# bpftrace -V
bpftrace v0.9.4
hello BPF world!
安装完成后在/usr/sbin目录下会多出一些*.bt的文件:
root@iZj6c18dsejt417tcv4rv2Z:/usr/sbin# ll *.bt
-rwxr-xr-x 1 root root  698 Feb  5  2020 bashreadline.bt*
-rwxr-xr-x 1 root root  603 Feb  5  2020 biolatency.bt*
-rwxr-xr-x 1 root root  888 Feb  5  2020 biosnoop.bt*
-rwxr-xr-x 1 root root  884 Feb  5  2020 biostacks.bt*
-rwxr-xr-x 1 root root  569 Feb  5  2020 bitesize.bt*
-rwxr-xr-x 1 root root 1839 Feb  5  2020 capable.bt*
-rwxr-xr-x 1 root root  497 Feb  5  2020 cpuwalk.bt*
-rwxr-xr-x 1 root root 1204 Feb  5  2020 dcsnoop.bt*
-rwxr-xr-x 1 root root  780 Feb  5  2020 execsnoop.bt*
-rwxr-xr-x 1 root root 1388 Feb  5  2020 gethostlatency.bt*
-rwxr-xr-x 1 root root  867 Feb  5  2020 killsnoop.bt*
-rwxr-xr-x 1 root root 1127 Feb  5  2020 loads.bt*
-rwxr-xr-x 1 root root  661 Feb  5  2020 mdflush.bt*
-rwxr-xr-x 1 root root 1002 Feb  5  2020 naptime.bt*
-rwxr-xr-x 1 root root 1165 Feb  5  2020 oomkill.bt*
-rwxr-xr-x 1 root root  953 Feb  5  2020 opensnoop.bt*
-rwxr-xr-x 1 root root  628 Feb  5  2020 pidpersec.bt*
-rwxr-xr-x 1 root root  793 Feb  5  2020 runqlat.bt*
-rwxr-xr-x 1 root root 1052 Feb  5  2020 runqlen.bt*
-rwxr-xr-x 1 root root 1806 Feb  5  2020 setuids.bt*
-rwxr-xr-x 1 root root 1298 Feb  5  2020 statsnoop.bt*
-rwxr-xr-x 1 root root  600 Feb  5  2020 swapin.bt*
-rwxr-xr-x 1 root root  838 Feb  5  2020 syncsnoop.bt*
-rwxr-xr-x 1 root root  874 Feb  5  2020 syscount.bt*
-rwxr-xr-x 1 root root 1722 Feb  5  2020 tcpaccept.bt*
-rwxr-xr-x 1 root root 1617 Feb  5  2020 tcpconnect.bt*
-rwxr-xr-x 1 root root 2214 Feb  5  2020 tcpdrop.bt*
-rwxr-xr-x 1 root root 2753 Feb  5  2020 tcplife.bt*
-rwxr-xr-x 1 root root 2120 Feb  5  2020 tcpretrans.bt*
-rwxr-xr-x 1 root root  929 Feb  5  2020 tcpsynbl.bt*
-rwxr-xr-x 1 root root  705 Feb  5  2020 threadsnoop.bt*
-rwxr-xr-x 1 root root  515 Feb  5  2020 vfscount.bt*
-rwxr-xr-x 1 root root  721 Feb  5  2020 vfsstat.bt*
-rwxr-xr-x 1 root root 1704 Feb  5  2020 writeback.bt*
-rwxr-xr-x 1 root root  972 Feb  5  2020 xfsdist.bt*
这里以execsnoop.bt为例,这个脚本会"嗅探"所有使用exec()的系统调用:
root@iZj6c18dsejt417tcv4rv2Z:/usr/sbin# cat execsnoop.bt
#!/usr/bin/env bpftrace
/*
 * execsnoop.bt   Trace new processes via exec() syscalls.
 *                For Linux, uses bpftrace and eBPF.
 *
 * This traces when processes call exec(). It is handy for identifying new
 * processes created via the usual fork()->exec() sequence. Note that the
 * return value is not currently traced, so the exec() may have failed.
 *
 * TODO: switch to tracepoints args. Support more args. Include retval.
 *
 * This is a bpftrace version of the bcc tool of the same name.
 *
 * 15-Nov-2017  Brendan Gregg   Created this.
 * 11-Sep-2018     "     "      Switched to use join().
 */

BEGIN
{
        printf("%-10s %-5s %s\n", "TIME(ms)", "PID", "ARGS");
}

tracepoint:syscalls:sys_enter_execve
{
        printf("%-10u %-5d ", elapsed / 1000000, pid);
        join(args->argv);
}
这里作者还在《BPF之巅》这本书里吐槽了一下自己名字没取好,应该叫做trace而不是snoop更合适一些,看样子取名才是编程里面最难的哈哈。
先运行这个脚本:
root@iZj6c18dsejt417tcv4rv2Z:/usr/sbin# bpftrace execsnoop.bt
Attaching 2 probes...
TIME(ms)   PID   ARGS
这里先来个思考题,python中会使用os.system()函数来执行一些简单的系统命令,这个函数背后到底是怎么运行的呢?
打开另一个终端页面,执行python3进入一个shell,然后输入:
>>> import os
>>> os.system("date")
这时,我们就可以看到运行execsnoop.bt的窗口有了新的输出:
root@iZj6c18dsejt417tcv4rv2Z:/usr/sbin# bpftrace execsnoop.bt
Attaching 2 probes...
TIME(ms)   PID   ARGS
6096       121028 python3
16880      121029 sh -c date
16881      121030 date
也就是说os.system()函数本质上就是sh -c命令。这里补充个Linux基础知识,“sh -c"可以让bash将一个字串作为完整的命令来执行,也就是将sudo影响范围扩展到整条命令,特别是在没有root权限而命令又需要结合管道、重定向一类的语句时使用,可以解决权限导致问题。
除了把脚本写成bt文件外,btfgrace也支持直接使用命令行+语句的方式执行,类似直接使用python -c xxx或者sh -c xxx,比如上面的脚本就可以使用一行命令:
bpftrace -e 'tracepoint:syscalls:sys_enter_execve{ printf("%-10u %-5d ", elapsed / 1000000, pid);join(args->argv); }'
BPF程序只有在对应的事件被触发时才会被调用,所以hello,world!可以这么干:
bpftrace -e 'tracepoint:raw_syscalls:sys_enter{ printf("Hello BPF World!\n")}'
这行脚本会监听所有的系统调用,也就是会不停的打印直到Ctrl+C停止程序。
或者直接bpftrace -e 'BEGIN {printf(Hello BPF world!);}',Ctrl+C停止程序时会输出。
BCC
安装
根据安装说明结合自己环境的实际情况安装即可,我这里用的ubuntu直接使用:sudo apt-get install bpfcc-tools linux-headers-$(uname -r)安装,安装成功后可以看到/usr/sbin目录下多了很多*-bpfcc的二进制文件(注意这里不同发行版可能不带bpfcc尾缀)。
比如运行execsnoop-bpfcc,功能和上面执行的execsnoop.bt是一样的,只不过功能更强大了:
root@iZj6c18dsejt417tcv4rv2Z:/usr/sbin# ./execsnoop-bpfcc -h
usage: execsnoop-bpfcc [-h] [-T] [-t] [-x] [-q] [-n NAME] [-l LINE]
                       [--max-args MAX_ARGS]

Trace exec() syscalls

optional arguments:
  -h, --help            show this help message and exit
  -T, --time            include time column on output (HH:MM:SS)
  -t, --timestamp       include timestamp on output
  -x, --fails           include failed exec()s
  -q, --quote           Add quotemarks (") around arguments.
  -n NAME, --name NAME  only print commands matching this name (regex), any arg
  -l LINE, --line LINE  only print commands where arg contains this line (regex)
  --max-args MAX_ARGS   maximum number of arguments parsed and displayed, defaults to
                        20

examples:
    ./execsnoop           # trace all exec() syscalls
    ./execsnoop -x        # include failed exec()s
    ./execsnoop -T        # include time (HH:MM:SS)
    ./execsnoop -t        # include timestamps
    ./execsnoop -q        # add "quotemarks" around arguments
    ./execsnoop -n main   # only print command lines containing "main"
    ./execsnoop -l tpkg   # only print command where arguments contains "tpkg"


root@iZj6c18dsejt417tcv4rv2Z:/usr/sbin# ./execsnoop-bpfcc
PCOMM            PID    PPID   RET ARGS
ls               121180 120876   0 /usr/bin/ls --color=auto
uname            121181 120876   0 /usr/bin/uname
使用BCC开发BPF程序,至少需要有C、Python的基本语法知识,倪朋飞大佬总结BPF程序的开发和执行需要5个步骤:
- 第一步,使用 C 语言开发一个 eBPF 程序;
- 第二步,借助 LLVM 把 eBPF 程序编译成 BPF 字节码;
- 第三步,通过 bpf 系统调用,把 BPF 字节码提交给内核;
- 第四步,内核验证并运行 BPF 字节码,并把相应的状态保存到 BPF 映射中;
- 第五步,用户程序通过 BPF 映射查询 BPF 字节码的运行状态。
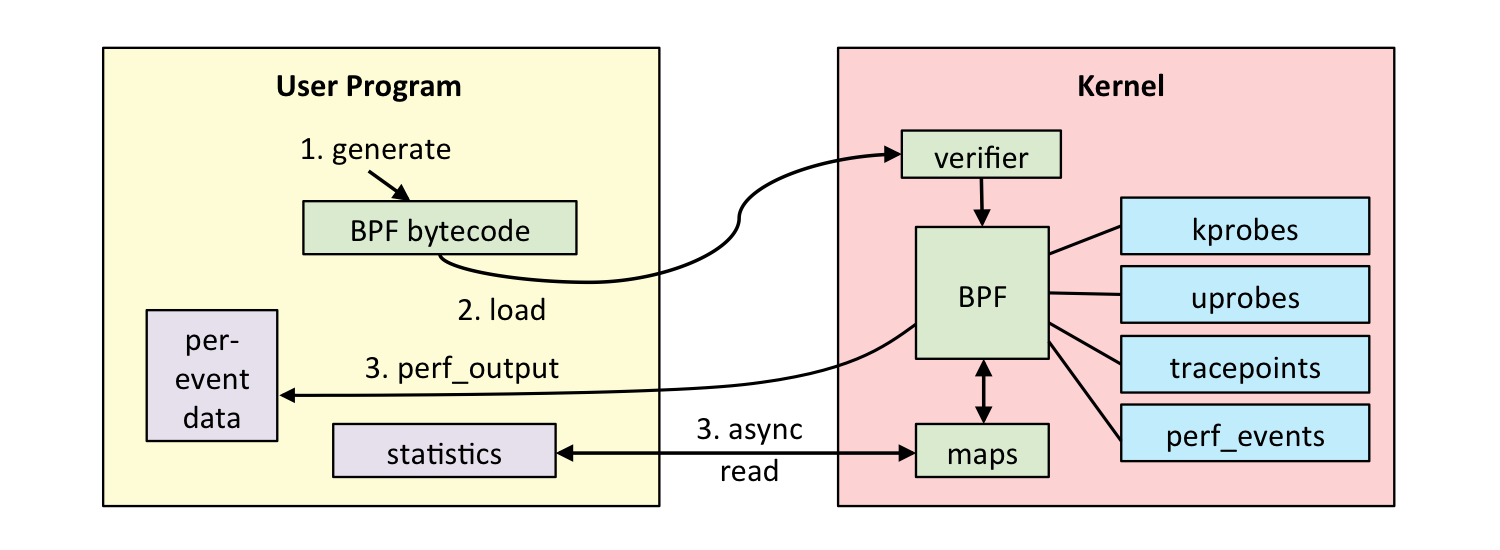
BCC除了提供了现成的工具外,还是一个BPF编译器集合,包含了用于构建BPF 程序的编程框架和库。使用BCC的好处是,它把上述的 eBPF 执行过程通过内置框架抽象了起来,并提供了 Python等编程语言接口。这样,可以直接通过 Python 语言去跟 eBPF 的各种事件和数据进行交互。
hello BPF world!
这里我们看一下官网提供的 例子:
#!/usr/bin/python
# Copyright (c) PLUMgrid, Inc.
# Licensed under the Apache License, Version 2.0 (the "License")

# run in project examples directory with:
# sudo ./hello_world.py"
# see trace_fields.py for a longer example

from bcc import BPF

# This may not work for 4.17 on x64, you need replace kprobe__sys_clone with kprobe____x64_sys_clone
BPF(text='int kprobe__sys_clone(void *ctx) { bpf_trace_printk("Hello, World!\\n"); return 0; }').trace_print()
很简单,2行代码就搞定了一个BPF程序,首先import对应的BCC库,然后创建一个BPF对象,并传递一个C语言的程序代码给text参数,最后调用trace_print()输出。
其中,C语言的代码就是定义了一个函数,监听所有 sys_clone 内核函数的调用,这个函数被触发了就调用BCC提供的辅助函数 bpf_trace_printk() 输出。
运行程序后,在另一个终端里随便输入点命令,运行结果如下:
root@iZj6c18dsejt417tcv4rv2Z:~/# python3 hello.py
b'            bash-120596  [004] .... 1059077.215170: 0: Hello, World!'
b'            bash-120596  [004] .... 1059079.961080: 0: Hello, World!'
b'            bash-121232  [007] .... 1059079.961478: 0: Hello, World!'
b'            bash-120596  [004] .... 1059081.117114: 0: Hello, World!'
b'            bash-121234  [007] .... 1059081.117505: 0: Hello, World!'
其中:
- bash-xxxx 表示进程的名字和 PID;
- [00x] 表示 CPU 编号;
- … 表示一系列的选项;
- 1059081.117114 表示时间戳;
- 0 表示函数返回值;
- 最后的 “Hello, World!” 就是调用
bpf_trace_printk()传入的字符串。